
What does equity mean and why does it matter?
In this section, we examine racial and ethnic disparities in financial, education and community indicators.
Before understanding data sets, it is important to define what ‘equity’ means. Sometimes, equity and equality are used interchangeably. Arkansas Community Foundation’s experience working with nonprofits shows us that these two terms mean different things. Understanding the differences influences how we, and you, can have an impact in our communities.
Equity recognizes that each person has different circumstances and allocates resources and opportunities needed to reach an equal outcome.
Equality means every individual or group of people is given the same resources or opportunities.
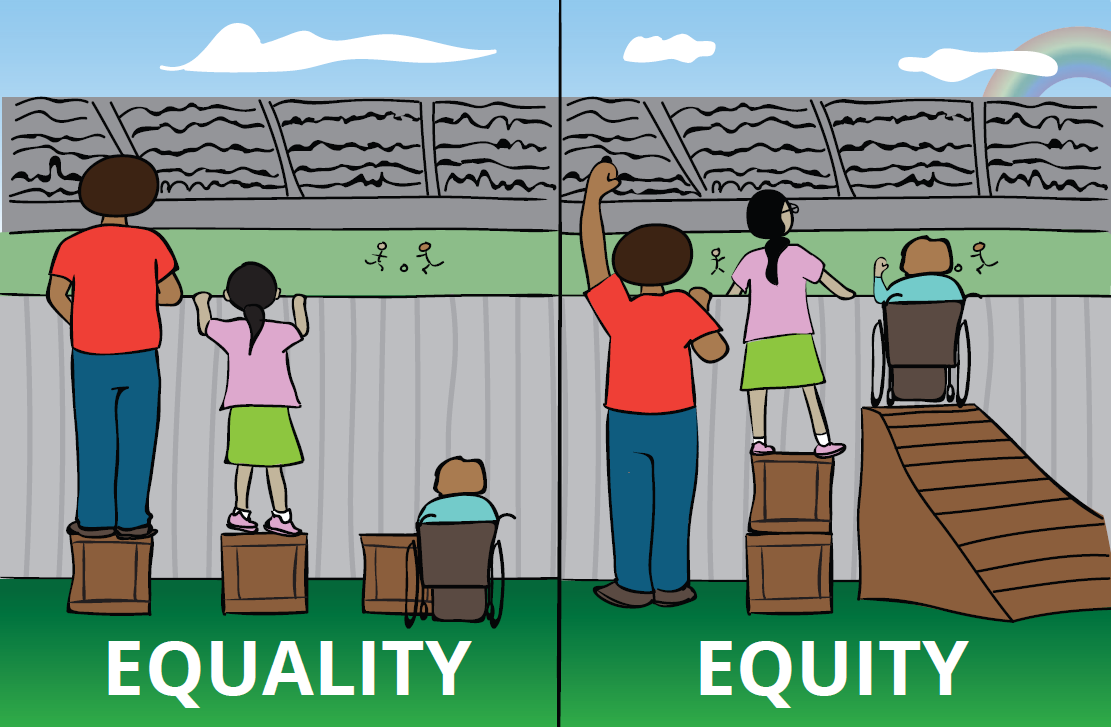
Understanding the difference between equality and equity is important to ensure that resources are directed appropriately as well as to support the ongoing process of meeting people where they are. Providing the same type and number of resources to all is not enough. To reduce the disparities gap, the underlying issues and individual needs of underserved and vulnerable populations must also be effectively addressed. Here are some examples to help show the importance of equity in our communities:
|
Examples of EQUALITY |
Examples of EQUITY |
|
A city cuts the budget for 25 community centers by reducing the operational hours for all centers by the same amount at the same times. |
The city determines which times and how many hours communities actually need to use their community centers and reduces hours for centers that aren’t used as frequently. |
|
A community meeting, where all members of the community are invited, is held about a local environmental health concern. The meeting is held in English, however English is not the primary language for 25% of the residents. |
The community leaders hire translators to attend the meeting, provide brochures explaining the issue in multiple languages, or offer an additional meeting held in another language. |
|
All public schools in a community have computer labs with the same number of computers and hours of operation during school hours. |
Computer labs in lower income neighborhoods have more computers and printers, as well as longer hours of operation, as some students don’t have access to computers or internet at home. |
Racial and ethnic disparities impact our population of nearly 500,000 African Americans and 237,000 Latino residents in Arkansas. Arkansas is also home to more than 50,000 Asians, 31,000 Native Americans, 12,000 Pacific Islanders and 67,000 residents who have a multiracial background. Unfortunately, Arkansas has a history of policies, practices and systems that affect people of color and have helped create some of the disparities in the data.
Fortunately, there are a plethora of resources, including this site, we can use to better understand these inequities and how we can address them. There are data resources such as the National Equity Atlas; racial equity-focused research from organizations like the Urban Institute; tools for learning and change such as those available at Racial Equity Tools, and personal narratives from writers such as Ta-Nehisi Coates.
More tools about equity:


